
Making things crystal clear
In last week’s look at descriptive statistics, you learnt that the type of data (nominal, ordinal or interval/ratio) suggested the type of descriptive statistics that you should use for your analysis.
After you have conducted your descriptive statistical analysis, all you know is that there is a difference between the two groups or conditions. In order to know if that difference is significant (i.e. that there is less than a 5% probability that the difference is due to chance) you need to run an inferential statistical test.
Now we’re going to look at how you can choose which type of inferential statistical test to use. The most common inferential tests are either the Mann-Whitney test or the Wilcoxon test.
If you have two groups (independent samples design) and either ordinal or interval/ratio data, choose the Mann-Whitney test. Your level of significance should be p< 0.05 (that’s the less than 5% chance mentioned above.
If you have one group that was subjected to two conditions (repeated measures design) and have either ordinal or interval/ratio data, choose the Wilcoxon test, and again use the level of significance of p< 0.05
If you have an independent samples design and nominal data, then you will need to run a chi-square test. If you have a repeated measures design and nominal data, then a sign test is needed.
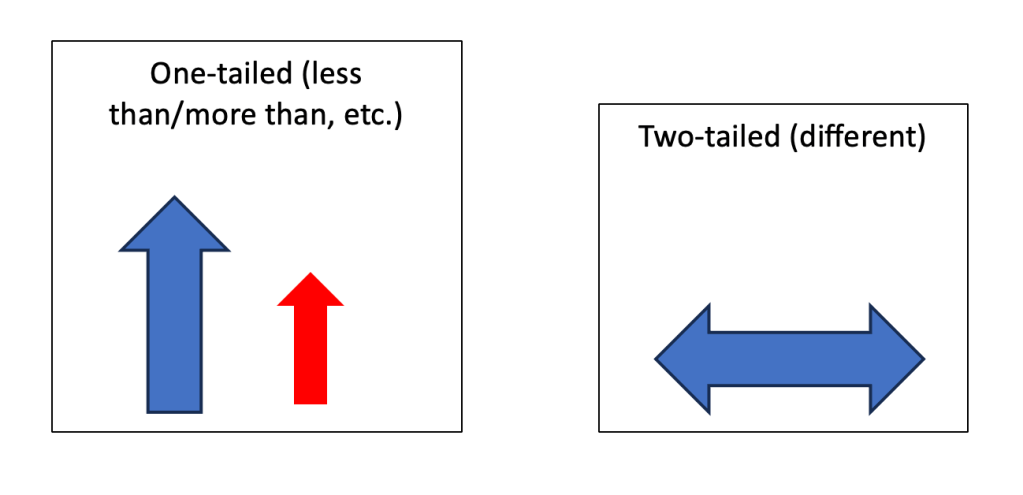
Finally, look back at your hypothesis. How is it worded? Does it say that people under X condition will do better/worse than those under Y condition; or that those in Group A will remember more words than those in group B? If it does, then you are predicting the direction of the difference and this means you have a directional hypothesis, and need to run a one-tailed test.
But if your hypothesis just says there will be a difference between how those in one condition or group do on the test compared with those in the other group, then you are not predicting the direction, and so this is a non-directional hypothesis and you will run a two-tailed test.
The sites below will help you run your tests and show you the results for one or two-tailed tests. Just choose the appropriate one.
After you have found your results, you then write your statement of the findings. Something like ‘The Mann-Whitney test showed that the critical limit for our results to be significant at p<0.05 with 10 participants in each group was U= 27. Our statistical analysis gave our U value as 31, which is above the critical value and so our results are not significant. We have to accept our null hypothesis. (Your null hypothesis is basically that there will be no difference between the groups).
Remember, these are simplified examples to help you get your head around what can seem a complex process. Don’t copy these pages for your IA, but use them as an easy reference to guide you.
You have now written your analysis, with a descriptive statistics table and bar graph, and interpretation of the statistics, and with your inferential statistical analysis results and statement. The final section before your references and appendices is the Evaluation – and we’ll visit that in a day or two.
