So, you prepared all your forms and materials, gained permission, set up the classroom[s] and conducted your experiment and you have anonymised raw data for the two conditions. This has to be analysed, firstly with descriptive statistics, according to the type of data.
Nominal: organised by category – yes/no, A/B or positive/negative.
Example: the framing effect asks participants to choose whether they would prefer solution A or solution B, based on how the solutions to a problem were framed in terms of loss (Tversky & Kahneman, 1981).
Measure of central tendency is the mode. Measure of variance (dispersion, though there are only two categories) is the variation ratio.
Ordinal: ranked, with not necessarily the same difference between each rank. A Likert (1-5) scale is a good example of this. People have different ideas about what the highest rank, middle ranks and the lowest rank actually mean and so the data is not equally spaced along the number line.
Example: the halo effect asks participants to rank attributes of a teacher on a scale, depending on which video of the teacher they watched (Nisbett & Wilson, 1977)
Measure of central tendency is the median. Measure of dispersion is the inter-quartile ratio (IQR)
Interval/Ratio: measured on a scale where the gaps between the positions on the scale are the same distance from each other. Ratio has a true zero (think speed travelled, time taken, number of words remembered). Interval doesn’t have a true zero. They can be treated the same for the purpose of the IA.
Example: comparing the number of five-syllable words from a twenty-word list that can be remembered in a set time with the number of one-syllable words that can be remembered in the same time (Baddeley et al., 1975).
Measure of central tendency is the mean. Measure of dispersion is the standard deviation (SD).
Next, construct a table with your descriptive statistics within it. This is not part of the criteria, but it makes it much easier for people reading the IA to identify your measures. I haven’t entered data; you will have your own (corrected to 2 or 3 significant figures).
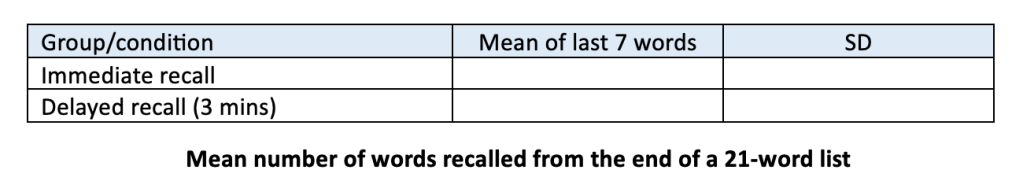
Say what the statistics show: what was the difference between the two groups? Was it in the direction you expected? What does the standard deviation tell you about the spread of the data in each group?
Finally, you need to show your descriptive statistics in a bar graph.

There are several online sites that will explain descriptive statistics and help you to calculate them. These are two of my favourites:
Coming up soon – inferential statistical analysis.
